Top five annoying questions at scientific meetings

5. Question: “You know, our group has been working on this for a long time, and we found that…”

Really means: “How come you got invited to talk about this and not I?”

4. Question:  “Have you tried using Y instead of X?”

Really means: “We are doing the same thing using Y, since we can’t afford to use X on our budget. But we haven’t had results in the past two years, and you totally scooped us. Is there any way we can actually get results using Y?”

3. Question: “So where do you think this work is going?”

Really means: “I was just scratching my head, and the microphone runner thought I was raising my hand and handed me the mike.  Now that I actually have the mike, I might as well ask something”.

2. Question:  “You know, I was just talking about this recently with Bigshot1 and Bigshot2, and they said that…”

Really means:  “Hey, look at me!  I’m important enough to have engaged both Bigshot1 and Bigshot2 together in a conference. (They couldn’t get away because it was the conference dinner with free booze).”

1. Question:  “It seems that this whole field of…. is filled with very exciting prospects. We have been looking into…. and Bigshot3 has recently published in Science….(3-4 minutes more in the same vein)  so my question is: what are your thoughts?”

Really means: “Muahahaha. By hijacking Q&A time, I got to present at this conference even though I was not invited to. Sucks to the Program Committee”

Attendees at the CXXXVII Symposium on Whatever

Attendees at the CXXXVII Symposium on Whatever

Share and Enjoy:
  • Fark
  • Digg
  • Technorati
  • del.icio.us
  • StumbleUpon
  • Facebook
  • Reddit
  • Twitter
  • FriendFeed
  • PDF
  • email
  • Print
  • Google Bookmarks

Skin Flick 2: Statistic Boogaloo

ResearchBlogging.org

Reports on the first metagenomic survey of skin bacteria (see my previous post) did not go unnoticed by the popular media. Reports appear in US News & world Report, LA Times, Times of India, National Geographic, and Scientific American. All these articles have one thing in common: they are wrong. Yes, even Scientific American.

All those articles reported, among other things, on the most diverse and least diverse bacterial skin populations using samples taken from different sites on the skin. All of them, to a tee, reported that the forearm has the highest species diversity, and the least diversity is behind the ears.

Let us look at the figure from the article (Figure 2, Grice EA et al. Science 29 May 2009:
Vol. 324. no. 5931, pp. 1190 – 1192):

bacterial-diversity-stats

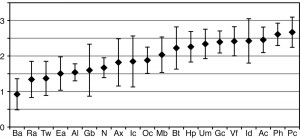
The different sites are spread along the X axis. The diversity using the Shannon-Wiener diversity index is shown along the Y axis. A higher number means a higher diversity. The data points represent the median diversity from the ten people  surveyed.  Grice and her colleagues also included error bars in this figure, showing the absolute deviation from the median.

There is a two-way tie-in for the highest diversity between the Pc (behind the knee) and Ph (planar heel) points.  Then come the Ac (elbow pit) and the Id (finger webbing) with Vf  (forearm) coming only fifth. Also, if you consider the error bars, it is highly likely the differences between those medians are not statistically significant. Also, the site with least diversity is the back (Ba), while the retroaural crease (Ra, behind the ears) is second to last in diversity. Also, the error bars may make this a tie too.

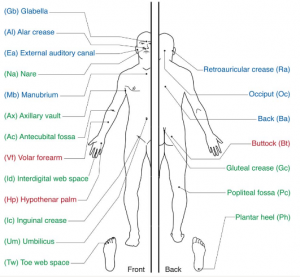
Where the skin samples were obtained. Click to enlarge

Where the skin samples were obtained. Click to enlarge

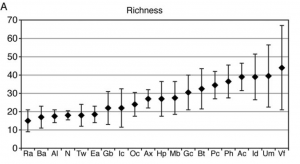
So what is going on here? Why does everyone claim that the forearms harbor the highest bacterial diversity, when the Science article reports they are only fifth or part of a large tie-in? The sort-of answer seems to lie in the supplemental material, Figure S3. In absolute species numbers, it does seem like the forearms have the most species, with a median of 44; although again, error bars are pretty extensive.

median richness

median richness

Why is the Shannon-Wiener diversity showcased in the front of the article, and the number of species (richness) relegated to the back, while all the channels report on the median richness and calling it diversity? Well, you can hardly blame them when Science itself reports, in its front window, the same thing. Well why is that?

My explanation is that it is easier to understand species richness (the actual number of species) than species diversity. The Shannon-Wiener diversity (SWD) provides a sum of the relative abundance of each species: that is, the contrast between the number of species we find and the number of species we expect given the number of individual animals (or clones, in this case) sampled. Diversity is more descriptive and informative than richness, since it provides us with a measure of how many species there are relative to what we expect, not just an abslolute number. However, this concept is not easy to communicate.   So someone in the Science press office decided to write a press-release with richness numbers, but omitted the distributions, and conflated richness and diversity.

This example highlights a larger subject: how to communicate science effectively, but without errors resulting from over-simplification?  Where does the border lie between simplifying, dumbing down,  and being simply wrong? In this example, the error is relatively minor: terms have been switched, but it is clear that the true values have been given. Highlighting a metric people can understand to communicate your work, even if it is not the best one, is better than using another, more informative one but which will simply obfuscate the  entire work. Science communication should be kept simple and that usually means that some details get lost along the way.  We just need to make sure that the core ideas are there, and that loss of details does not mean loss of reporting accuracy.

I would like to thank Elizabeth Grice for answering my questions so quickly and fully. If you are interested in some more skin microbiome details, here she is giving a talk at the Metagenomics 2008 meeting, held last November at UC San Diego:

Elizabeth Grice, Talk CALIT2 November 2008


Stephanie Pappas (2009). Your Body Is a Wonderland … of Bacteria ScienceNOW DOI: http://sciencenow.sciencemag.org/cgi/content/full/sciencenow;2009/528/1

Katherine Harmon (2009). Genetic survey finds healthy human skin is crawling with bacteria Scientific American DOI: http://www.scientificamerican.com/blog/60-second-science/post.cfm?id=genetic-survey-finds-healthy-human-2009-05-28

Elizabeth A. Grice, Heidi H. Kong, Sean Conlan, Clayton B. Deming, Joie Davis, Alice C. Young, NISC Comparative Sequencing Program, Gerard G. Bouffard, Robert W. Blakesley, Patrick R. Murray, Eric D. Green, Maria L. Turner, & Julia A. Segre (2009). Topographical and Temporal Diversity of the Human Skin Microbiome Science, 324 (5931), 1190-1192 DOI: http://www.sciencemag.org/cgi/content/full/324/5931/1190

Share and Enjoy:
  • Fark
  • Digg
  • Technorati
  • del.icio.us
  • StumbleUpon
  • Facebook
  • Reddit
  • Twitter
  • FriendFeed
  • PDF
  • email
  • Print
  • Google Bookmarks

Short bioinformatics hacks, ch. 2: chunk it.

First, a non-bioinformatic one liner, which is very relevant to most of us working on 3 different machines simultaneously, not including the 80 in our cluster. ssh-ing and giving your password each time is painful, and makes it almost impossible to do scripted file transfers, like backups. A good solution is shared key ssh in which the host machine recognizes the trusted machine as a client. Thus, after an initial setup you can ssh without typing in your password each time. However, if you want to establish a shared key ssh to a remote machine, you have to (1) generate a local key by running ssh-keygen locally; (2) scp the ~/.ssh/id_rsa.pub to the remote server (3) ssh to the remote server and append that key to your remote ~/.ssh/authorized_keys file. Which means 2 password typings at least, and lots of stuff to recall (or to search on the web) if you do not do this too often. Kyle Rankin comes to our rescue offering this one liner to solve the problem in the June 2009 issue of Linux Journal:

ssh user@server.example.net "cat >> ~/.ssh/authorized_keys" < ~/.ssh/id_rsa.pub

This hack will establish your shared key ssh with one fell Enter keystroke. Done.

And now, to bioinformatics.

I am partial to Python and Biopython, so the following example will be in Python, using the Biopython package. Biopython is an open-source package with many bioinformatic tools. You can download and install it from the biopython.org site, or  if you are using Linux, some distributions carry their own version. For example, in Ubuntu installation is as easy as:

sudo aptitude install python-biopython python-biopython-doc

The problem at hand is splitting a sequence file containing many sequences (thousands or millions) into something more manageable for, say, over the network analysis, where bandwidth or file size are restricted. Or maybe as a first step in Embarrassingly ParallelTM analysis on a cluster computer. However, before I continue I should mention that the Biopython Cookbook has another, more generic solution to this problem.

#!/usr/bin/python
# Copyright (c) 2009 Iddo Friedberg. Distributed under the Biopython
# license available from  http://www.biopython.org/DIST/LICENSE
import os
import sys
import getopt
from Bio import SeqIO
def chunk_sequences(infile, outfile_basename=None, chunk_size=100, seq_format="fasta"):
    if not outfile_basename:
        outfile_basename = os.path.splitext(infile.name)[0]
    n = 0
    chunk_list = []
    for seq_record in SeqIO.parse(infile, seq_format):
        n += 1
        chunk_list.append(seq_record)
        if n % chunk_size == 0:
            fout = open("%s_%d.%s" % (outfile_basename, n//chunk_size, seq_format), "w")
            SeqIO.write(chunk_list, fout, seq_format)
            chunk_list = []
    if chunk_list:
        fout = open("%s_%d.%s" % (outfile_basename, n//chunk_size + 1, seq_format), "w")
        SeqIO.write(chunk_list, fout, seq_format)

def usage():
    print "usage: chunk_sequences -i infile [-o outfile] [-s size] [-f format]"

if __name__ == '__main__':
    try:
        opts, args = getopt.getopt(sys.argv[1:], "i:o:s:f:")
    except getopt.GetoptError:
        usage()
        sys.exit(2)
    inpath = None
    outfile_basename = None
    chunk_size = 100
    seq_format = "fasta"

    for o, a in opts:
        if o == "-i":
            inpath = a
        elif o == "-o":
            outfile_basename = a
        elif o == "-s":
            chunk_size = int(a)
        elif o == "-f":
            seq_format = a

    if not inpath:
        usage()
        sys.exit(2)

    chunk_sequences(open(inpath), outfile_basename, chunk_size, seq_format)


Walking through the code. Line 7 imports a Biopython package:  SeqIO reads and writes sequence files in various formats. Most common formats are supported for reading, but not all  are supported for writing. This changes over Biopython versions, so check the documentation of your own Biopython installation to see which file formats are write-supported. In any case, FASTA format is supported, and that is what we will be using here.

Lines 8-20 are the actual splitting, or “chunking” function. Function definition of chunk_sequences on line 8: infile is the seqeunce file to be read, outfile_basename is the base for the output files (that will be numbered, eg.  “basefile_1.fa, basefile_2.fa”, etc.); chunk_size is the number of sequences per output file (default 100).

Lines 9-12: initializations.

Lines 13-22: read the FASTA file in a for loop using SeqIO’s parser functionality. chunk_list is a mutable array, the Python workhorse, called a list. We append sequence records to chunk_list until the number of records in a chunk is reached (checked in line 14). If it is reached, the chunk file is written to, and the chunk counter is incremented. Once we leave the loop, we write the remaining sequences, if any, one last time.

The function chunk_sequences can be called from a Python shell, from another Python function. The file can also be run as a command from the operating system shell. That is what lines 25-53 are for

Lines 24-25: a short function writing the text of an error message.

Line 27: a standard Python toy t check if the program is being run from the command line.

Lines 28- end: make use of Python’s arguments/ options command line parser, using the Python implementation of GNU getopt. For more on how this works, read here.

chunky_monkey

To split a large FASTA file into a series of files containing 500 sequences each:

chunk_sequences mylargefile.fa -o smallchunk  -s 500 -f fasta

This will create a series of files: smallchunk_1.fasta  smallchunk_2.fasta and so on. Yay.

Happy chunking.

Update: thanks to Peter for the fixes (see comment section). I updated the script.

Share and Enjoy:
  • Fark
  • Digg
  • Technorati
  • del.icio.us
  • StumbleUpon
  • Facebook
  • Reddit
  • Twitter
  • FriendFeed
  • PDF
  • email
  • Print
  • Google Bookmarks

Skin flick

ResearchBlogging.org

Interesting report in Science today about the human skin metagenome. The skin is a fairly large organ, and it is home to an estimated 1012 bacteria. It is the first barrier our body poses against pathogens, toxins, and sarcastic comments.  An adult’s skin area is about 2m2, virtually all of it exposed to the outside world, picking up microbes, particles, small critters like the demodex (eyelash mite), and any residual matter from what we touch or touches us.

Title: Calculate Your Body Surface Area
Description: 'Enter height, weight gender and age'

As an aside, the skin’s 2m2 surface area pales in comparison to that of the small intestine: 250m2, due to the huge number of villi used to absorb nutrients from the food; Also the lungs are estimated to have 160m2, with their sponge-like consistency.

Until now, any study of the human skin microbiome was limited to those bacteria that could be cultured. The NIH has recently funded a $115M five year effort to study the human microbiome using metagenomic methods, that is, without the need to culture bacteria. As part of that, the initial species survey for skin is available now in Science. The researchers at the National Human Genome Research Institute in Bethesda, MD USA swabbed ten volunteers from different parts of their skin, and sequenced the 16S ribosmal RNA used for phylogenetic classification. They then looked at composition and the diversity of the bacterial communities in different areas of the skin.  There are seven tie-ins for first place in diversity: behind the knee, on the heel, inner elbow, between the fingers, on the forearm, in the navel and the gluteal crease . The least diverse populations were on the back, and behind the ears(!?)

Credit: meganpru on Flickr

Credit: meganpru on Flickr

Another comparison they made was left-right symmetry, or rather the lack thereof. There are significant differences in bacterial population and diversity between the left and right sides. This was unexpected, and still unclear to why that is. Differences between “dry” “moist” and “oily” areas in the skin were also very pronounced, although that not entirely unexpected.

Where the skin samples were obtained

Where the skin samples were obtained. Click to enlarge. Grice et al (2009) Science 1190-1192

The goal of this report is to understand what is the normal bacterial population on the human skin, so we can understand what goes wrong in disease, an maybe be able to better diagnose skin disease. And not only skin diseases: the dreaded Methicillin resistant Staphylococcus aureus (MRSA) which causes thousands of hospital deaths each year lives benignly in our nasal cavity. Understanding its “ecological niche” can lead to a better way to combat it, or at least to keep it at bay.
One thing that was unclear to me was whether this project will go on to sample non prokaryal populations: i.e. fungi, viruses and microscopic mites. Some of the most bothersome skin infections, from ringworm to athlete’s foot are not caused by bacteria. Fungi, viruses and microscopic animals are also residents on out 2m2 of real estate.

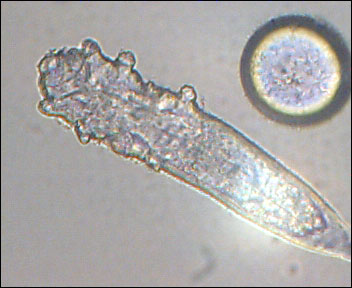
Eyelash mite as seen under a light microsope. Credit: Wikimedia Commons


Elizabeth A. Grice, Heidi H. Kong, Sean Conlan, Clayton B. Deming, Joie Davis, Alice C. Young, NISC Comparative Sequencing Program, Gerard G. Bouffard, Robert W. Blakesley, Patrick R. Murray, Eric D. Green, Maria L. Turner, & Julia A. Segre (2009). Topographical and Temporal Diversity of the Human Skin Microbiome Science, 324 (5931), 1190-1192 DOI: http://www.sciencemag.org/cgi/content/full/324/5931/1190

Share and Enjoy:
  • Fark
  • Digg
  • Technorati
  • del.icio.us
  • StumbleUpon
  • Facebook
  • Reddit
  • Twitter
  • FriendFeed
  • PDF
  • email
  • Print
  • Google Bookmarks

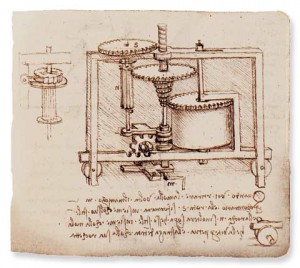
Leonardo Da Vinci and the F0-F1 ATPase

ResearchBlogging.org Offspring #2 (O2) and I  spent last weekend visiting the Da Vinci Experience exhibit at San Diego’s Air & Space Museum. The exhibit is engineer’s heaven: large wood models based on and inspired by LDV’s drawings. Gears, crankshafts, pulleys. O2 was interested in the military stuff:  catapults, the tank , a mobile bridge. I did not know LDV designed a mobile bridge:

Artoo and bridge

Ohtoo and the mobile bridge, built according to LDV specs

LDV Ball Bearings. Credit: <a href=

There were a lot of gear exhibits, which I did not photograph unfortunately.  Efficient and accurate transfer of motion was a big thing with LDV.  Another thing I did not know: he probably invented the ball bearing.

Gears, by LDV

Gears, by LDV

So when I saw Nature’s special section on membrane protein biophysics , something clicked.   We normally associate the rotary mechanism and gear transfer with human engineering, rather than with nature. Maybe it is human arrogance having invented the wheel and later the gear transfer as a form of locomotion. No other creature uses wheels for locomotion (but see below), hence we are smarter than nature since we came up with an engineering solution She did not.

Only that pride is misplaced. Two of the most common protein complexes in nature rely on a rotary motor, gears, torque, kinetically efficient transfer of motion, and all that jazz that powers our vehicles. One is the bacterial flagella: technically bacteria do use wheels for locomotion then (although the transfer of motion they use it more like a ship’s corkscrew, another LDV first).  The other is the F0-F1 ATPase.  It is a mushroom shaped complex motor embedded in our mitochondrial membranes and is powered by the electric potential across the membrane to generate Adenosine Tri Phosphate. ATP is the universal coin of energy in the living cell, and the F0-F1 ATPase generates 32 out of every 36 ATP molecules which cells need to exist. It is a heavily researched complex and intricate piece of machinery, central to almost all life. The F0-F1 ATPase’s gear-transfer mechanism is described in the article as “… composed of two rotary motors/generators that are mechanically coupled by a central rotor and an eccentric stator“. (Junge et al Nature 459, 364-370). And here is a movie explaining F0-F1 mechanics in detail. LDV would have liked this, I’m sure. He might have even broken into a Mona Lisa smile, or gone into a Mona Lisa Overdrive.
Update: Harvard University removed this video from Youtube. As to the whys and wherefores, see here.

Junge, W., Sielaff, H., & Engelbrecht, S. (2009). Torque generation and elastic power transmission in the rotary FOF1-ATPase Nature, 459 (7245), 364-370 DOI: 10.1038/nature08145

Share and Enjoy:
  • Fark
  • Digg
  • Technorati
  • del.icio.us
  • StumbleUpon
  • Facebook
  • Reddit
  • Twitter
  • FriendFeed
  • PDF
  • email
  • Print
  • Google Bookmarks

Short Bioinformatics Hacks, ch. 1

In any programming gig, and that includes bioinformatics, a lot of repeat scriptology comes cropping up. I decided to share some of that, pro publico bono, and also because I hope to start some sort of ongoing cookbook  for short bioinformatics hacks. If you have any cool short scripts you like to share, please email them to me and once I collected a few I will place them in a future post.  The programing language does not matter, as long as you provide a full working code and license it under an open source license. I’m not saying I will publish everything you send me though.

Okay, let’s get started.

The hack I use most often is to find out how many sequences I have in a FASTA file. The FASTA file header should be one line, and always start with a “>”. therefore, counting the number of sequence records is as easy as:

% grep ">" mysequences.fa | wc -l
grep -c "^>" mysequences.fa  (with thanks to Paulo Nuin for the simplification).

Simply using Linux’s built in wc or word count grep, with a “-l” “-c” for number of matching  lines.

Using the same idea, here is a sequence length printer. The goal is to print the length of each sequence from a FASTA format file that contains many sequences:

1 % gawk '/>/ {$0=substr($0,2); sid=$1;next} \
2             {sl[sid]+=length($0)} \
3         END {for (i in sl) printf "%s\t%d\n",i,sl[i]}'  \
4         mysequences.fa > dist.csv

Download listing.

gawk” is GNU-awk, the workhorse for text file manipulation before Perl and such came along. I still like using it for quick throwaway coding. A gawk program is composed of a series of rules , consisting of a pattern and an action in the following manner:

pattern1 {action1}
pattern2 {action2}
.
.
.

The code is executed on the entire input file (“mysequences.fa”), one line at a time. If the pattern matches the input line, then the appropriate action is taken. A rule can exist without a pattern, in which case the action is always executed.

Line 1 in the source code above shows a rule that checks for the “>” character. If it exists, that means the current line is a FASTA header line.  gawk considers input lines to be records composed of fields. Fields are separated by whitespace characters, records by newlines or carriage-returns. The fields in any current record are named $1, $2, $3… and the entire record is referred to as $0. Using substr (substring) we chop off the leftmost character in the FASTA header, which is the ubiquitous “>”. (Note that in gawk, indexing starts at 1, not 0, so “>” is in position 1 in $0). We then use the first field in the modified FASTA header line as a sequence id key, sid. Finally, the command “next” tells gawk to move to the next input line, skipping all the other rules.

Moving to the next rule, the rule in line 2 only gets executed if we are already in a sequence line in FASTA. This rule has no pattern qualifying it, but if we have reached this rule, it means we cannot be in a header line, which leaves us in a sequence line. “sl” is an associative array, which uses the sequence ID generated in line 1 as its key.  This rule simply increments the size of each entry in sl by the length of the current line. Thus eventually storing the sequence length for each sequence in an associative array, with the key being the sequence ID

After the entire FASTA file has been read, we would like print out a table with the sequence IDs and their lengths. This is where line #3 comes in: one special rule in gawk is the rule with the END pattern. This rule gets executed one time only, and only after the entire file has been read.  The for loop goes through the associative array sl, and prints consisting of tab-separated fields: the first is the sequence ID, the second is its length.

You can now import dist.csv into your favorite spreadsheet program, or into R, and examine the distribution of sequence lengths.

A word of caution: for this to work, the first field in the FASTA file should be unique. This is according to the NCBI specifications of FASTA files, but some places do not follow this rule, so take care.  Here is another gawk script to warn you if your FASTA file is breaking this rule:

gawk  '/>/ {$0=substr($0,2); sl[$1]+=1} \
       END {for (i in sl) \
       {if (sl[i]>1) printf "WARNING. Non unique id %s\n",i}}' \
       mysequences.fasta

Download listing

Finally, in the same vein, here is a GC percentage calculator:

1 gawk '/>/ {$0=substr($0,2); sid=$1; next} \
2          {sl[sid]+=length($0); gccount[sid]+=gsub(/[GgCc]/,"X",$0)} \
3      END {for(i in gccount) printf "%s\t%.2f\n",i,gccount[i]/sl[i]}' \
4      mysequences.fasta > gc_count.csv

Download listing.

The only major change here is in  line 2. The gsub command replaces all the G, g, C and c characters with an X. That really does not matter to us, as this is done on the fly, and the Xs are not written into the the original FASTA file. But gsub also returns the number of replacements made, and that is actually how we count “G”s and “C”s (or “g”s and “c”s in case you decide to be case insensitive, like I decided here).  The for loop in the END rule simply divides the GC count for each sequence by that sequence’s length.

This is about as complex as you want to go for command line throwaway scripts, especially in gawk which is prone to obfuscation.  For anything more complex, it’s a good idea to start using a structured language, preferably with its own Bio* package. There are two reasons for that. First, even if you are a hot-shot coder, and you trust your h@x0r sk1llz with writing one-shot one-liners, this is not the place: no one is infallible. You  need to keep a record in of the source code for future reproducibility. Also, in case something goes wrong down the data manipulation pipeline, and you need  to backtrace the bug. A one-line throwaway is only as long- lived  as the history cache of the shell in which it was written.

Next time I will do some longer stuff. Until then, if you like this piece, send me your scripts.  They can be as short as the ones here, or longer, and in any language. Please test them before you send, and OSS license them.

Share and Enjoy:
  • Fark
  • Digg
  • Technorati
  • del.icio.us
  • StumbleUpon
  • Facebook
  • Reddit
  • Twitter
  • FriendFeed
  • PDF
  • email
  • Print
  • Google Bookmarks

Light for Cellular Communication?

ResearchBlogging.org

Don't you know
We're all light
Yeah, I read that someplace
 --XTC

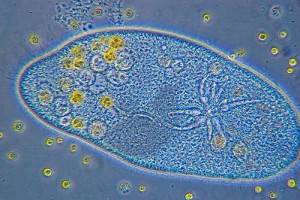
This is interesting: an article in PLoS ONE that claims that Paramecia can communicate using light. The author, Daniel Fels from the Swiss Tropical Institute in Basel, separated two Paramecia populations using quartz or glass vials, grew them in the dark, and checked whether the separated, but close populations, affect each others growth and feeding rates. The correlation he found was strong. Large populations in one vial affected the growth rate of small populations in the adjacent vial.

Uses light to communicate? Credit: <a href=

The main problem I have with this study (and similar ones he cites) is that the evidence is mostly negative: i.e. by eliminating other possible causes, he arrives at the conclusion that the only probable signalling mechanism is self-emitted light. Fels controlled for other ambient effects  such as heat and diffusion by evaporation. Also, he used glass and crystal vials in different experiments, and has shown that results differ depending on the vial material.  Since glass and crystal filter different wavelengths this was interpreted as  having at least two different wavelengths convey signals. (one spectrum above 340nm, and the other below).  However, Fels did not directly detect the proposed photons.  The claim is that the electromagentic radiation is too weak to be picked up by external sensors. But I believe there are microsensors that are sensitive to single-photon emissions that could be used in the medium. Nor did he use an independent source of photons to simulate the population radiation. Again, something I believe can be tried.

Apparently this is not the first study of the mysterious and elusive (or non-existent?) biophotonic activity: Fels cites a whole slew of previous studies, in the same vein, conducted with yeast, onion roots and some animal tissue cells. The emerging picture is that there may be such a phenomenon, but it hasn’t been shown directly, yet.

Anyhow, here is a FriendFeed discussion I started, (update: I removed the framing of the FriendFeed discussion from this post since it went from discussing science, to discussing discussions) You are welcome to comment here, or better yet, in the comments section in the PLoS ONE article itself (login required).

SlashdotLogo

This article has< been slashdotted. Exercise extreme caution.


Fels, D. (2009). Cellular Communication through Light PLoS ONE, 4 (4) DOI: 10.1371/journal.pone.0005086

Share and Enjoy:
  • Fark
  • Digg
  • Technorati
  • del.icio.us
  • StumbleUpon
  • Facebook
  • Reddit
  • Twitter
  • FriendFeed
  • PDF
  • email
  • Print
  • Google Bookmarks

Total waste of time, ep. 1

Warning: frivolously geeky and technical  post, which can be best defined as “science methodology esoterica”, and from which you can learn absolutely nothing useful.  If you don’t get what’s going on, then it’s probably for the best, because this is a complete waste of time.

Specific Aim 1:  find the longest word in English composed of the Protein 20-letter alphabet.

Method: I like gawk for quick & dirty text processing:

gawk 'BEGIN {daword="a"} \
/[BbJjOoUuXx]/ {next} \
length($1) > length(daword) {daword=$1} \
END  {print daword}' /usr/share/dict/web2

acetylphenylhydrazine

OK, this kinda sucks. I want a real word in English, not a chemical portmanteau. Let’s see what a top 10 list looks like:

gawk 'BEGIN {for(i=1;i<=10;i++) daword[i]="a"} \
/[BbJjOoUuXx]/ {next} \
{for (i in daword) {if (length($1) > length(daword[i])) {daword[i]=$1;break}}} \
END  {for (i=1;i<=10;i++) print length(daword[i]), daword[i]}' \
/usr/share/dict/web2 | sort -nr

And the result:

21 pentamethylenediamine
21 acetylphenylhydrazine
20 paraphenylenediamine
20 metaphenylenediamine
20 interparenthetically
19 transcendentalistic
19 semiantiministerial
19 platymesaticephalic
19 peripachymeningitis

19 misapprehensiveness

Interparenthetically. How lovely if you do your bioinformatics in Lisp.

Specific Aim 2: Lets BLAST this

Method: NCBI TBLASTN:

>
emb|CAK04910.1| Gene info novel protein similar to vertebrate Hermansky-Pudlak syndrome
3 (HPS3) [Danio rerio]
Length=1041

 GENE ID: 563666 LOC563666 | similar to LOC398456 protein [Danio rerio]

 Score = 30.3 bits (64),  Expect =    22
 Identities = 9/10 (90%), Positives = 10/10 (100%), Gaps = 0/10 (0%)

Query  2    NTERPARENT  11
            NTERPAR+NT
Sbjct  505  NTERPARKNT  514

>
ref|XP_664219.1| Gene info hypothetical protein AN6615.2 [Aspergillus nidulans FGSC A4]
 sp|Q5AYL5.1|SEC16_EMENI  RecName: Full=COPII coat assembly protein sec16; AltName: Full=Protein
transport protein sec16
 gb|EAA58144.1| Gene info hypothetical protein AN6615.2 [Aspergillus nidulans FGSC A4]
Length=1947

 GENE ID: 2870538 AN6615.2 | hypothetical protein [Aspergillus nidulans FGSC A4]
(10 or fewer PubMed links)

 Score = 30.3 bits (64),  Expect =    22
 Identities = 10/13 (76%), Positives = 10/13 (76%), Gaps = 0/13 (0%)

Query  1   INTERPARENTHE  13
           INTE PARE T E
Sbjct  61  INTESPAREETAE  73

>
ref|XP_001707965.1| Gene info hypothetical protein [Giardia lamblia ATCC 50803]
 gb|EDO80291.1| Gene info Hypothetical protein GL50803_14341 [Giardia lamblia ATCC 50803]
Length=247

 GENE ID: 5700874 GL50803_14341 | hypothetical protein
[Giardia lamblia ATCC 50803] (10 or fewer PubMed links)

 Score = 30.3 bits (64),  Expect =    22
 Identities = 9/12 (75%), Positives = 10/12 (83%), Gaps = 0/12 (0%)

Query  4    ERPARENTHETI  15
            ER ARE THE+I
Sbjct  221  EREAREKTHESI  232

>
ref|YP_002191813.1| Gene info conserved hypothetical protein [Streptomyces clavuligerus ATCC
27064]
 gb|EDY50943.1| Gene info conserved hypothetical protein [Streptomyces clavuligerus ATCC
27064]
Length=565

 GENE ID: 6836469 SSCG_04068 | hypothetical protein
[Streptomyces clavuligerus ATCC 27064]

 Score = 29.5 bits (62),  Expect =    39
 Identities = 12/20 (60%), Positives = 13/20 (65%), Gaps = 1/20 (5%)

Query  1    INTERPARENTHETICALLY  20
            I  ERP R +T E I ALLY
Sbjct  219  ITAERPQRTDT-EAIGALLY  237

Interesting, but the e-values are insignificant. PSI-BLAST, BLASTP against metagenomic sequences in CAMERA all came up with zip.

Conclusion: I totally wasted my time doing this, and yours reading this. Therefore, I need more funding to check the other words on the list.

Share and Enjoy:
  • Fark
  • Digg
  • Technorati
  • del.icio.us
  • StumbleUpon
  • Facebook
  • Reddit
  • Twitter
  • FriendFeed
  • PDF
  • email
  • Print
  • Google Bookmarks

Oprah, Jenny McCarthy and Preventable Diseases

Shirley Wu has penned a beautiful open letter to Oprah Winfrey explaining why Oprah should not provide a soapbox to Jenny McCarthy. McCarthy is the unofficial spokesperson for the anti-vaccination movement, a dishonorable position at best.  Given yet another podium, more people will listen and take McCarthy’s bad advice, resulting in more deaths and preventable serious illnesses.

Remember this?

Remember this?

Share and Enjoy:
  • Fark
  • Digg
  • Technorati
  • del.icio.us
  • StumbleUpon
  • Facebook
  • Reddit
  • Twitter
  • FriendFeed
  • PDF
  • email
  • Print
  • Google Bookmarks

John Lee Hooker: One Bourbon, One Scotch, One Beer

Phew. After getting slashdotted on the Wolfram Alpha story, I can use a couple of drinks.

Share and Enjoy:
  • Fark
  • Digg
  • Technorati
  • del.icio.us
  • StumbleUpon
  • Facebook
  • Reddit
  • Twitter
  • FriendFeed
  • PDF
  • email
  • Print
  • Google Bookmarks

Test driving the Wolfram Alpha

There has been a lot of buzz recently about Wolfram’s new product, the Wolfram Alpha (WA). After attending a webinar on WA, I was given a preview account, and started messing around with it.  In case you were wondering, that is the extent of my involvement with Wolfram Research, LLC, I don’t even have a Mathematica license. After playing around with WA for a few hours, I can safely say the following: it’s different, it’s incomplete, it’s idiosyncratic, and it’s  funky cool. And  no, it will not dethrone Google, nor does it aim to do so. Pish-posh.

It’s Different

Stephen Wolfram describes WA as a “computational knowledge engine”. It is not a web search engine: the information is curated and internal to WA, not searched over the web. Neither is WA an encyclopaedia: the information it provides on any topic is rudimentary, and mostly calculable. If you enter a country’s name, it will give you its GDP, GNP, size, population, but not its history.  WA is more like an almanac with computational capabilities.

Yes, you can look up facts, like the GDP of Germany,  the population of London, or the height of the Eiger.  But the real power of WA lies in its ability to take data that can be numerically represented, and compute new relationships. A simple example is who has the larger population: Los-Angeles or New-York, and by how much?
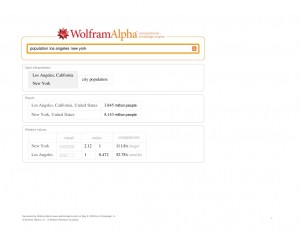
wolframalpha-populationlosangelesnewyork

LA vs. NYC. Click to Enlarge

wolframalpha-populationlosangelesnewyork

It also shows comparative population growth over time.

The input screen is a single-line entry field, a-la Google, with quite a few links to examples, help docs, a blog, downloads (such as browser plugins) and an FAQ which is empty for now.  The input field can supposedly take regular queries in English, and figure out a computable answer. You can also narrow down your query to a certain parameter, for example “males Canada Germany” will  give you a comparison only of the male population of those two countries.

The output can be manipulated to show the results in different views. For example, you can show a weather forecast in Celsius or Fahrenheit. You can also show or hide results you may deem too detailed.  You can also generate a PDF of the output, for download and archiving. However, the PDF is generated from the original query, and not from the modified output screen.

WA can be used to settle Guinness Book of World Records-like disputes, here is what “fastest car” brought me; you can also ask for the “highest mountain” or “oldest person”.

WA really kicks butt when it comes to math. But then again, it’s got Mathematica behind it, so in this context, it is basically a Mathematica front-end capable of deciphering natural language queries. No mean feat, really, but quite expected from the authors of Mathematica. Here is a thorough Mathematica-style analysis of the function  sin(x)/cos(y). The PDF was rather large here, because of the graphics ( 13MB, another thing to fix, WA developers!),  I whittled it down to manageable jpegs:

sin(x)*cos(x) p.1 Click to enlarge

sin(x)*cos(x) p.1 Click to enlarge

sin(x)*cos(y) p 2. Click to enlarge

sin(x)*cos(y) p 2. Click to enlarge

sin(x)*cos(y) p 3. Click to enlarge

sin(x)*cos(y) p 3. Click to enlarge

And a matrix rotation:
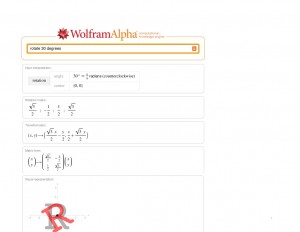
Matrix rotation, click to enlarge

Matrix rotation, click to enlarge

Some everyday calculations, such as “compound interest,” or “body mass index” open  a form where you can enter the parameters (principal, interest & maturity or height and weight, respectively) and receive a solution, including a graph over time for compound interest. When I entered “Moore’s Law”, I was pleasantly surprised to get form which lets me calculate the number of transistors per integrated circuits over time (Moore’s Law is a well-known empirical  geeky law that states this number doubles every 18 months).

Anything to do with Biology? Yes. For starters, WA has a quite a few organisms.  I typed “pea rose” and here is what I got:
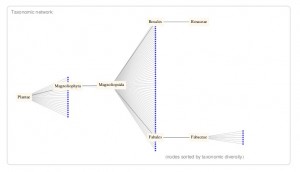
Pea vs. Rose. Click to enlarge

Pea vs. Rose. Click to enlarge

WA also hosts the sequence of the human genome (not sure if it’s Venter’s, Watson’s or NCBI’s).  You can enter a DNA sequence and get exact matches, including genes. Seems like they are only hosting translatable genes: I could not find a tRNA I was looking for, and no intergenic regions. Also, it only gives exact matches, so not a lot of functionality there.

How about music? Yep. It even plays scales and chords; like my favorite, the D blues scale.

It’s incomplete

Some things seem to be missing, on a rather arbitrary basis. Here I need to explain something: it seems like every query word in WA is tagged as parts of a larger contextual semantic set. For example, “rose” can be a person’s name, but it can also be a plant. New York can be a city, or a state. WA makes intelligent guesses  based on query context: if you query “population New York California” it will compare state populations, if you query “population New York San Diego” it will compare city populations.

That being said, yeast is tagged as a food, but not as an organism, so I could not compare yeast to pea on a phylogenetic tree like I did with rose and pea in the example above. By the way,  rose can be a given name, or a surname, or a species, or a color, or a word, or a financial entity (stock ticker of Rosetta Resources Inc.). A rose in different semantic contexts in may not smell as sweet tho’ it be called by the same name.

Which reminds me, that “Romeo and Juliet” is tagged as a book or a movie (why not a play?). As a movie, WA brings us information on all three versions:  George Cukor’s 1936 version, Franco Zephirelli’s 1968, and Baz Kuhrman’s 1996 (yeah, the crappy one, with DiCaprio). I could not get them side by side though, which is a shame: I like comparing movie versions, and who played whom.

In some cases, I couldn’t get graphs for functions where one of the variables was a denominator, and I am not sure why: if it’s because they are not handling zero division yet? Unlikely.

The main model organisms, Arabidopsis thaliana,(thale cress) Drosophila melanogaster (fruit fly), Escherichia coli (a bacterium) and Caenorhabditis elegans (nematode worm) are not listed. Strange, as although these are not exactly what the man on the street would think of as interesting species, they are central to life science, and I would expect them to be in a knowledge resource such as  WA. Saccharomyces cerevisiae (baker’s yeast) and Danio rerio (zebra fish) are actually in there.  If WA is interested in taking a slice out of the genomic browsing pie, it would do well to enter the genomes of those organisms as well. Then we could do some neat, if rudimentary, comparative genomics. As far as I could gather, only the human genome is in WA now. It would be cool to use WA for some quick & dirty comparative genomics.

One big point: I could not find how to drill deeper. Once I got, say, the schematic phylogenetic tree of two organisms, can I zoom in? Or once I get the GDPs of Germany and Canada side by side, can I look for private vs. public sector GDP? Trade deficit? I hope that once the documentation is in place, this would sort itself out.

It’s idiosyncratic

Small annoyances: imperial units and North American date formats are mostly the norm, except for scientific entries where SI standards are adhered to. Diseases are tagged as “cause of death”, so mortality statistics are given, but not morbidity.

Anyone who read A New Kind of Science knows about Wofram’s fascination with cellular automata. WA does cellular automata too: typing “rule 60” got me this:

wolframalpha-rule60

Rule 60 gives a cellular automaton. Click to enlarge.

So the phrase “rule (number)” automatically maps to Wofram’s idea of what a rule is, which is a cellular automaton rule.

It’s funky cool

Let me end by repeating where I started: WA is not a web search engine, and not an encyclopedia. No crowdsourcing or community-generated  knowledge here. WA works mostly with curated sources, computable data, and hence allows for comparison.  There is a bit of a learning curve regarding query syntax, and documentation is sorely lacking on that, but I hope it will  be there by May 18, the announced release date. When all is said and done, I had lots of fun with WA. The single command line is very limiting, but Wolfram said in his webinar that they will provide some measure of an API to the public, and of course to whose who will purchase the commercial product. I hope that drill-down capabilities would be improved (or at least documented) because that is where the real strenght of this tool lies.

Oh, I almost forgot: you can compare apples and oranges. So there!

Update: for the slashdotters who asked about the “Meaning of Life”:  not entirely unexpected:
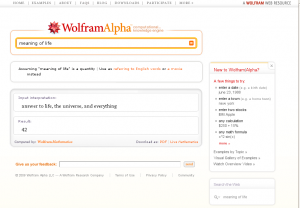
Meaning of life

Meaning of Life click to enlarge

Share and Enjoy:
  • Fark
  • Digg
  • Technorati
  • del.icio.us
  • StumbleUpon
  • Facebook
  • Reddit
  • Twitter
  • FriendFeed
  • PDF
  • email
  • Print
  • Google Bookmarks

The Seven Deadly Sins and Seven Heavenly Virtues of Scientific Websites

When I say here “scientific websites”, I am not referring to education sites, science blogs, or scientific journal web sites. I am talking about sites scientists use for their day to day research. Sites like Entrez, EBI, FlyBase, ExPasy, PDB etc. The sites I just mentioned I deem quite virtuous, but there are many sinful sites out there. We all run into them, some of us are guilty of them at one time or another, as no-one is without sin 🙂  Sinful sites will drag you into the hellfire of obscurity, whereas virtuous sites will earn you the heaven of peer recognition, citations, and perhaps even some funding.

The Seven Deadly Sins:

1. Lust:   “form over function”: beautiful site design, lovely widgets, gadgets, interactive semi-transparent whachamallits but how exactly do I work this application? Where is the application?

2. Gluttony: stuffing my browser with Javascript code until it chokes and grinds to a halt.

3. Greed: lock your application, do not provide the source code. Also, if you want to make your site a paysite, fine. But if it’s free, (and definitely if it is paid) please keep it down to two  Google ads and one banner. If I see to another Flash drop-down  I will go away and never come back.

4. Sloth: Not updating your reference databases, not maintaining your code, broken links.

5. Wrath: not providing documentation to your application; not answering query emails (or worse, giving a half-hearted response).

6.  Envy: not designing your web site with an an API in mind. If you site is good and useful, don’t force your user to click their carpal tunnel into oblivion. Let them be able to write code to better use your site as a web-service. Throttle incoming traffic if you must, but let it come in.

7. Pride: not being able to take criticism, and make appropriate changes based on users’ comments. Also, a soul-sucking registration followed by too many emails.

The Seven Heavenly Virtues:

1. Chastity: a lean website. Minimal to zero use of Google web toolkit, Java applets, and other flashy yet often useless bells & whistles.

2. Temperance:  fast applications, with a load well split between server and browser.

3. Charity: open source you applications. Provide a downloadable, standalone version of your WWW application under an OSI open source license.

4. Diligence: maintain your code. Run periodic application checks to see that everything works. Don’t wait for the users to inform you of a crash or a bug. Keep  as close as possible to the latest version of your scripting language, web interface, OS, server software and DBI.

5. Patience: Take time and effort to document your web site and standalone applications well.  Make sure you answer all query emails within 24 hours, even if  your answer is “sorry, busy now.. please hold on another day”.

6. Kindness: Provide APIs and dynamic URLs,  so your site can be used as a web service. Document al URL formats, and API toolkits. Make sure error messages are meaningful. If you need to throttle traffic, advise users of the traffic throttling policy.

7. Humility: remember, those using your website are the best judges of its usefulness to them. Leave a clearly marked contact email for comments. Read those comments, and act on them.

Photos from [klf]photography on flickr under CC/attribution/non-commercial

Share and Enjoy:
  • Fark
  • Digg
  • Technorati
  • del.icio.us
  • StumbleUpon
  • Facebook
  • Reddit
  • Twitter
  • FriendFeed
  • PDF
  • email
  • Print
  • Google Bookmarks

I tweet, you twit

Sooo… NIH and NSF started Tweeting. Nice. A good way to keep up with grant programs, funding opportunities, yadda yadda. Here’s my @ tweet :

@NIH protein catalytic site evolution health implic: good for drug design. 
Young scientist, need $0.7M 2010-2013, 2xpostdocs+cluster+travel. 
Prev pubs: http://is.gd/vnPN; kthxbi

I hope I won’t get killed at the renewal…

Share and Enjoy:
  • Fark
  • Digg
  • Technorati
  • del.icio.us
  • StumbleUpon
  • Facebook
  • Reddit
  • Twitter
  • FriendFeed
  • PDF
  • email
  • Print
  • Google Bookmarks

Music: The Dub Side of the Moon

One of those dumb ideas that I’m very glad someone went through with: a reggae/dub cover for Pink Floyd’s The Dark Side of the Moon. It’s incredible! I downloaded the first 10 tracks from eMusic, and once my subscription get refilled I’ll download the remaining four. Then I will check whether The Dub Side also synchronizes with The Wizard of Oz.

Share and Enjoy:
  • Fark
  • Digg
  • Technorati
  • del.icio.us
  • StumbleUpon
  • Facebook
  • Reddit
  • Twitter
  • FriendFeed
  • PDF
  • email
  • Print
  • Google Bookmarks

Size matters. Life is Live.

1976: Prologue

In July 27, 1976, the American Legion, a US military veterans association, held a large meeting at the Bellevue Stratford Hotel a hotel in Philadelphia PA, celebrating the USA’s bicentennial year. Within 2 days, guests  started falling ill with an atypical pneumonia. By the end of the week, 221 people were ill and 34 died in from an unidentified respiratory disease.  Samples that were taken from the air conditioning’s cooling tower’s water yielded a formerly unknown bacterium.  Legionella pneumophila was discovered, isolated and typified. “Legion Fever” or Legionnaire’s disease became a household name. It is estimated the US has between 10,000 and 50,000 cases of Legionelliosis each year.  Legionella bacteria have been found to be typically in poorly maintained air-conditioning systems, whirlpool baths, indoor fountains, breathing apparatuses and any other warm water source where water is not constantly replaced or treated. The discovery of Legionella prompted new standards for maintaining such facilities and appliances.

1992-2002:”That’s no bacterium”

Fast forward to 1992, when several people become ill with pneumonia in the West Yorkshire town of Bradford.  Because of the pattern of infection, the UK heath authorities suspected Legionellosis. Timothy Rowbotham from the English Public Health Laboratories  had extensive experience with  Legionella, and where to look for it. He collected samples from the water of  a nearby cooling tower.  No Legionella was found, but a small gram-positive cocccus-like microorganism was discovered infecting amoeba from the water in the cooling tower. Rowbotham named it  Bradfordcoccus. Besides a name, very little was discovered about the new bug. The samples lay in the freezer for a few years, since Rowbotham could not culture it.

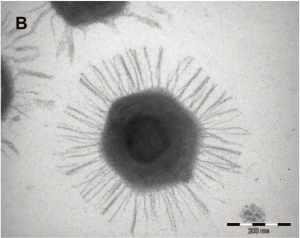
Electron micrograph of a Mimivirus

Electron micrograph of a Mimivirus

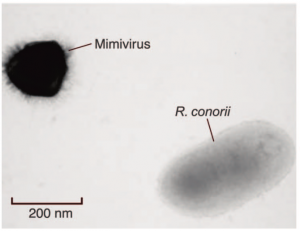
Ten years later, in 2002, work on Bradfordcoccus suddenly resumed when Richard Birtle brought samples from Rowbotham’s lab to the School of Medicine in Marseilles, to work with Didier Raoult on identifying pneumonia causing agents that grew in amoeba. Raoult’s lab specialized in intracellular bacteria and was experienced in isolating, culturing and identifying those elusive cells-within-cells. Samples from various different Legionella outbreaks were analyzed, and new strains of Legionella were identified. The Bradford sample was a frustration though: the typical way to identify bacteria is to isolate its DNA and then look for a specific marker genes, like a barcode, which identifies it. The gene customarily used is the 16S ribosomal RNA. This is the RNA that constitutes part of the ribosome, the complex protein-and-RNA machinery used by all living things to translate messenger RNA into proteins. Only Bradfordcoccus did not seem to have any 16SrRNA genes. All living creatures have rRNA genes, so after a frustrating year of vain attempts Raoult suspected that Bradfordcoccus’s cell wall was simply highly resistant to all the digestive agents they used to try and break it down and release the nucleic acids inside.  It was time to take a much closer look at what was going on there. Raoult and Birtle prepared an electron microscope sample of amoebae infected with Bradfordcoccus. When the images came in they realized: that’s no bacterium they were looking at. Under a light microscope, the stained spots in the amoeba looked just like any other cocci type parasitic bacteria. But with the higher magnification and resolution of the electron microscope, the spots were shown to have a sharp hexagonal shape. This  made it clear that  they were looking not at a bacterium, but at a virus. Moreover, they were looking at the largest virus ever seen! At a whopping 0.75μm (micrometers), it was larger than quite a few bacteria.

Mimivirus and Ricketsiaa conorii (a bacterium)

Mimivirus and Ricketsiaa conorii (a bacterium)

That also explains the lack of 16rRNA: viruses do not have cellular translation machinery, including ribosomes and ribosomal RNA: they hijack that from their hosts. They named it the Amoeba polyphaga microbial mimicking virus, or mimivirus, or APMV.

2004. Genome: you gotta know what’s what

Year 2004.  Jean-Michel Claverie’s and Didier Raoult’s groups publish the genome of Mimivirus in Science. Guess what: a big virus has a big genome. At 1,181,404 nucleotides, 911 protein coding genes and 6 strucutral RNA genes it is bigger than some 25 bacteria and archeae. The coding density — ratio of coding regions to non-coding regions is 90%, which is high even for viruses. This means that only 10% of the viral genome does not code for genes. So why is it so large? Apparently, there are lots of duplications, including one region which is 20% of the genomes length. About 35% of the virus’s genes have a homolog in the genome. This is higher than in most bacteria: it seems like the small genomic real-estate constraint — the need for compactness in the virus genomic DNA due to its small size — does not worry the mimivirus too much. Even with duplication, that leaves 400 original genes in the genome.  That’s a lot of genes for a virus!

What’s in there? Lots of goodies, I cannot go over all of them here.  For example, Mimi has quite a few enzymes that  have to do with DNA repair and proofreading. That actually makes sense: if a virus has a small genome (HIV-2 has eight genes!), and a high replication error rate, many of the genomes would be duplicated from the template DNA strand, but only a few will be able to code for a whole virus. However, those few in ratio will still be quite a lot in number, so the virus can replicate itself at a  rate that is higher than replacement, allowing it to proliferate.  But the longer the genome, even with the same error frequency inserted in the replication process as in a small genome, the virus will accumulate a larger absolute number of errors per genome. The large absolute number of errors will rendering a higher ratio of newly transcribed genomes as non-operational. With a viral genome the size of a small bacterium, this means the virus may not be able to create viable copies of itself at the necessary replacement rate. Furthermore, the large number of duplicates may serve as a buffer against faulty viral DNA synthesis: if one copy of a gene is faulty, its viral homolog can still function.

2008-2009: The shape I’m in
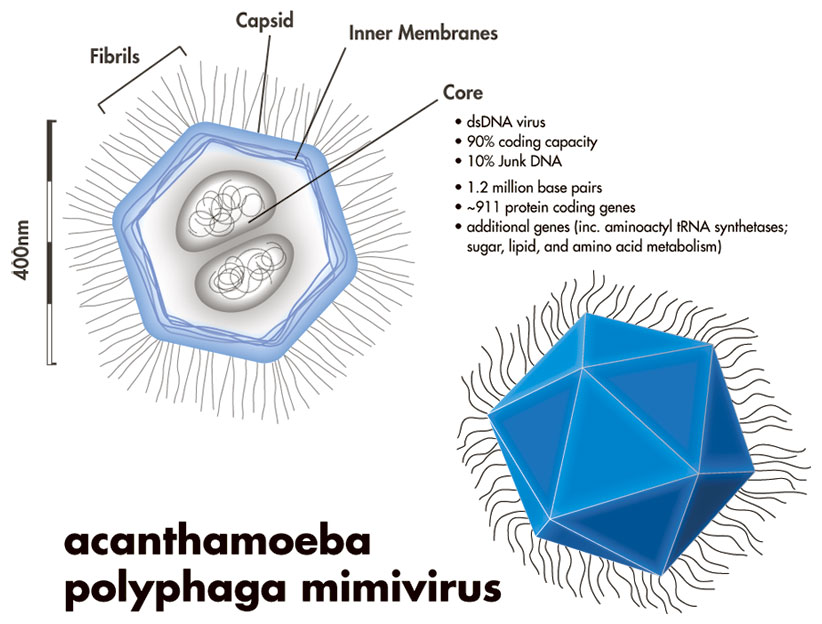
Mimivirus cutout. Wikimedia commons

Mimivirus cutout. Wikimedia commons

A cutout of mimivirus is shown above.  One theory holds that mimiviruses started as proto-nuclei during the emergence of eukaryotes, or nucleated cells. The viral DNA is organized in membrane-bound compartments, similar to a cell nucleus.  At the same time, the fibrils wrapping the virus have peptidoglycan components, similar to bacteria.

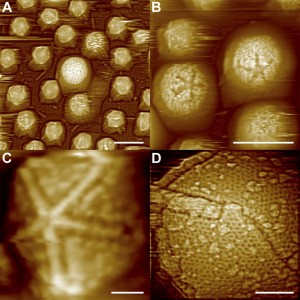
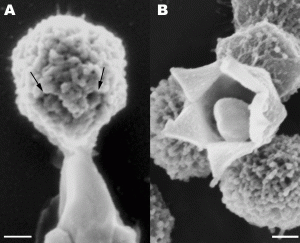
Each vertex on the virus’s surface is the meeting point of 5 triangles. There is one special vertex on the surface of the mimivirus, called “stargate” or “starfish”. The starfish seems to play a role in injecting the viral DNA into the amoeba host.

FM Images of Starfish-shaped Features on Defibered Mimiviruses

Atomic Force Microscope Images of Starfish-shaped Features on Defibered Mimiviruses. From: Structural Studies of the Giant Mimivirus Xiao C, Kuznetsov YG et al. (2009) PLoS Biology Vol. 7, No. 4, e92 doi:10.1371/journal.pbio.1000092

Stargate Opening From: Distinct DNA Exit and Packaging Portals in the Virus Acanthamoeba polyphaga mimivirus  Zauberman N, Mutsafi Y  et al. (2008) PLoS Biology Vol. 6, No. 5, e114 doi:10.1371/journal.pbio.0060114

Stargate Opening From: Distinct DNA Exit and Packaging Portals in the Virus Acanthamoeba polyphaga mimivirus Zauberman N, Mutsafi Y et al. (2008) PLoS Biology Vol. 6, No. 5, e114 doi:10.1371/journal.pbio.0060114

2008: Sputnik comes to Mama

If all this was not enough, it seems that being a big virus also causes big problems: in 2008, Raoult and his colleagues discovered that a strain of mimivirus, called mamavirus, had a virus of its own! The small 50nm virus, (1000 smaller in dimaeter than mamavirus) was dubbed Sputnik, “little companion” in Russian. (Eugene Koonin is a co-author on the paper. Being originally from Russia, now at the NIH,  I suspect he gave the new virus its name). Sputnik cannot infect the host amoeba by itself, but only when it is already infected with  mimivirus particles. Sputnik seems to grow in mamavirus aggregates, called “virus factories” within the amoeba. It disturbs the growth and proliferation of the mamavirus. Sputnik has a genome of 18,343 bp, with only 21 protein coding genes, 3 of which cluster so closely with the mamavirus genes, it is almost certain they were derived from mama.

2009. Epilogue: what is life?

All these findings raise the question of the definition of Life. The common scientific definition includes an active metabolism, and common replicative and transcriptional machinery. Mimi does not seem to have a metabolism, nor does it have the full complement of replicative machinery, although it does have some tRNA genes, which are used to assemble proteins. It does have lots of genes, duplication, complex membranes, its own nucleus, and even its own parasite that not only acts as a pathogen of the virus, it also uses transfers from its host’s genome.  Mimi may or may not be alive, but it certainly challenges our concepts of the living world, and causes us to think and redefine what we know and consider to be “alive”.

To finish up, here is the one hit wonder from the 80s, Opus. One of those songs that traumatized my youth, and were unfortunately burned into my psyche forever with the hot iron brand of incessant radio playings.  It’s relevant though, just like Sputnik is relevant to Mamavirus, and Mamavirus is relevant to amoebae, and amobae are relevant to life. What is life? Life is Live.


La Scola, B., Desnues, C., Pagnier, I., Robert, C., Barrassi, L., Fournous, G., Merchat, M., Suzan-Monti, M., Forterre, P., Koonin, E., & Raoult, D. (2008). The virophage as a unique parasite of the giant mimivirus Nature, 455 (7209), 100-104 DOI: 10.1038/nature07218

Xiao, C., Kuznetsov, Y., Sun, S., Hafenstein, S., Kostyuchenko, V., Chipman, P., Suzan-Monti, M., Raoult, D., McPherson, A., & Rossmann, M. (2009). Structural Studies of the Giant Mimivirus PLoS Biology, 7 (4) DOI: 10.1371/journal.pbio.1000092

Zauberman, N., Mutsafi, Y., Halevy, D., Shimoni, E., Klein, E., Xiao, C., Sun, S., & Minsky, A. (2008). Distinct DNA Exit and Packaging Portals in the Virus Acanthamoeba polyphaga mimivirus PLoS Biology, 6 (5) DOI: 10.1371/journal.pbio.0060114

J.-M.Claverie, C. Abergel, H. Ogata (2009). Mimivirus Current Topics in Microbiology and Immunology, 328, 89-121 DOI: 10.1007/978-3-540-68618-7_3

Raoult, D. (2004). The 1.2-Megabase Genome Sequence of Mimivirus Science, 306 (5700), 1344-1350 DOI: 10.1126/science.1101485

Didier Raoult (2005). The Journey from Rikettsia to Mimivirus ASM News, 278-285 DOI: www.asm.org/ASM/files/ccLibraryFiles/FILENAME/000000001583/znw00605000278.pdf

Share and Enjoy:
  • Fark
  • Digg
  • Technorati
  • del.icio.us
  • StumbleUpon
  • Facebook
  • Reddit
  • Twitter
  • FriendFeed
  • PDF
  • email
  • Print
  • Google Bookmarks