Gene and protein annotation: it’s worse than you thought
Sequencing centers keep pumping large amounts of sequence data into the omics-sphere (will I get a New Worst omics Word Award for this?) There is no way we can annotate even a small fraction of those experimentally and indeed most annotations are automatic, done bioinformatically. Typically function is inferred by homology: if the protein sequence is similar enough to that of a protein whose function has been determined, then homology is inferred: that is, the unknown and the known protein are descended from a common ancestor. Even more so, functional identity to the known protein are inferred: the assumption being, that the function did not change if the common ancestral protein is recent enough: that is, if the sequence identity is high enough. But there are problems: what is the threshold for determining not only homology, but functional identity? Even if two proteins are 95% identical in their amino-acid sequence, if the remaining 5% happen to include active site residues, these proteins may do completely different things. However, most new sequences are annotated just this way, with some variations.
Because of its volume, the veracity of the electronic annotation is rarely checked by experts. Also, the electronic annotations come from far and wide, with different annotation software using different databases to infer gene and protein function. This sets the stage to a huge game of Broken Telephone, where wrong annotations can propagate through many databases, accumulating errors. Imagine that we have an annotation program with a 90% accuracy rate. This means that given a query protein sequence and a “gold standard” 100% correct reference database, this programs infers the query sequence’s correct function 90 out of every 100 times. For a typical bacterial genome of 5000 genes, this would mean that 500 genes are wrongly annotated. Let’s cal our bacterium Bug1. Now we place those 500 wrong annotations (along with the 4500 correct ones) in the “definitive database” for this bacterium, called Bug1DB. Now this Bug1DB is used as a “gold standard”, and another genome is annotated, this time of Bug2. Let’s suppose, for argument’s sake, that the two genomes contain roughly the same homologous genes. Since every gene in Bug1 has a 10% probability of being wrongly re-annotated when transferred to Bug2, this would mean a compounding error of 0.10 * 500 = 50 genes from the original wrong 500 genes (we assume that “two wrongs do not make a right” and that an incorrect annotation of any incorrectly annotated gene would not revert to a correct annotation my mis-annotating it again). But it would also mean that, on average, 500-50 =450 genes from A that were correctly annotated the first time would be incorrectly annotated the second time. This means that Bug B now has 500+450= 950 mis-annotated genes. And this is through two filters of a Broken Telephone game using a highly accurate annotation program.
The trouble is, that a 90% accuracy rate is unrealistically optimistic. Also, having all 5000 genes in a genome annotated with some function (as opposed to simply “unknown”) is rather fanciful. So the mis-annotation problem is worse, even if transfer and re-annotation does not take place exactly as described. But just how much worse?
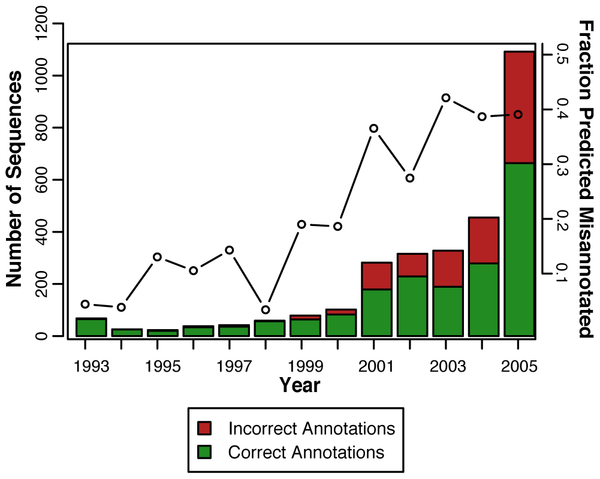
The question is answered in a rather disturbing study published in PLoS Computational Biology by Alexandra Schnoes and her colleagues in Patricia Babbit’s group at th University of California, San Francisco. They used 37 experimentally characterized enzyme families to test different databases. They found a high level of misannotation, but also a highly variable one. For example, the manually curated SwissProt database had a very low level of errors. On the other hand, TrEMBL, which uses simple sequence similarity for annotations, had a high level. So did NR, the combined GenBank coding sequence translations+RefSeq Proteins+PDB+SwissProt+PIR+PRF; pretty much the default reference database against which biologists BLAST their sequences. They found that 40% of the genes they examined were mis-annotated in NR. They also went back in time, examining the misannotaion fraction of their gold standard 37 families, and found that the fraction of misannotated genes has increased, from 15% in 1995 to 40% in 2005.

There are also many ways to be wrong, as Schnoes and her colleagues have discovered. Overprediction is one, where proteins are annotated with functions that are more specific than the available evidence supports. 85% of misannotations were found to be overpredictions. Of the remianing 15%, about half were found to be missing important amino acid residues, which means that they could not carry out the functions by which they were annotated. The other half were simply not within the similarity threshold necessary to include them in one of the superfamilies they have examined.
By now you are wondering, who is validating the validators? That is, if Schnoes and her colleagues determine a single cutoff for inclusion in a protein family, they might also include falsely annotated proteins as correctly annotated (false positive), or exclude correctly annotated proteins as mis-annotated (false negative). To avoid that, they set three different similarity thresholds to their 37 superfamlies, and examined which proteins the similarity searches attract. In the lowest of these threshold, they purposefully included the ability to include up to 5% false positives. This they called the “lenient threshold”, and they did check their results using these different thresholds (three of them). They found there was a slight increase, but no overall substantial change, in the discovered level of misannotation in the databases, even when lowering the bar to the lenient threshold.
So how bad is the level of misanntoation in the databases? It depends on the protein superfamily they checked against, and on the database. Here is an excerpt from another figure, showing the misannotation of protein families in the HAD haloacid dehalogenase (HAD) and amidohydrolaseand (AH) superfamilies of enzymes. Each rectangle represents a different database. The bar is the mean error in that database for that particular superfamily, and each colored circle is a protein family, placed and the level of average misannotation for that family. The circle size indicates the family size.

Percent misannotation in the families and superfamilies tested
Note that SwissProt fares very well, although lacks some families (those with an “X” through the blank circle). For the HAD superfamily, we see an error of 60% in the three other heavily used databases, and for AH we see a 40% error. That is brutally high, and quite worrying. Other families fared little better when checked against those databases. Some went up to 80% and 100%(!)
So what can be done? Schnoes and her colleagues suggest several remedies. First, include “evidence codes” with the annotations. Those will let us know how each annotation is inferred, and thus how trustworthy it is. Additionally, avoid overprediction, which accounts for 85% of wrong annotations. Many protein functions are described too specifically, without enough evidence to support the annotation claim. Taking a step back and giving a more general description of the function would go a long way towards cleaning up the databases. The manually curated databases such as SwissProt did fare very well in their examination, but manual curation is not possible anymore with the post-genomic and metagenomic data deluge. Large databases have to clean up the mess pretty much the same way it was created: by automated means. Let’s hope it will happen soon enough. A 40% error rate in the database you are looking at can really put a damp on your analysis.
Schnoes, A., Brown, S., Dodevski, I., & Babbitt, P. (2009). Annotation Error in Public Databases: Misannotation of Molecular Function in Enzyme Superfamilies PLoS Computational Biology, 5 (12) DOI: 10.1371/journal.pcbi.1000605


Great review of the paper. This really enforces that researchers have to take this error into account whenever they make biological inferences from large bioinformatics analyses.
Great review indeed. It underlines exactly what my tutor said: If it (a protein) hasn’t seen a lab then don’t take its name for granted. That was 1996 and it is still very very valid.