Annotating Proteins in the Uncanny Valley
The Uncanny Valley
Every day, software appears to do more things that we thought were exclusively in the human realm. Like beating a grandmaster in chess, or carrying out a conversation. I say “appears” because there is obviously no self-aware intelligence involved, as this rather bizarre conversation between Cleverbots demonstrates. For humans, playing chess and carrying out a conversation are products of a self-aware intelligence, which gives rise to symbolic representation of information that can be conveyed in speech or in writing, lead to enjoying an abstract game, and many many other good things.
Whereas in machines, playing chess and conversing is a an imitation, playacting if you will, of human activity. When Cleverbot talks, it is not fueled by sentience, but rather by many prior examples of scenarios fed into a learning algorithm. Chess and conversation are not produced by a real intelligence, anymore than the actor playing Hamlet really dies at the end of the play (sorry for the spoiler).
So we can relax, as we are still not HAL9000 or Skynet ready, nor is the human/machine merger singularity any nearer than it was. Still, certain upshots of human intelligence seemed to be emulated, with some success, by computers. The Cleverbot conversation is a a good example: it is a mostly comical but occasionally eerie caricature of human conversation, the eeriness stems from it being uncomfortably close to what we perceived to be a human-only activity, yet not that close. There is a name for the phenomenon of getting weirded-out by computer and robotic activities that are too similar to humans’: the Uncanny Valley. In a certain place on the graph between the dimensions of familiarity and human likeness, familiarity drops precipitously, and we freak out. In the Uncanny Valley, certain things become like humans (zombies, bunraku puppets, actroids, and the post-multi-surgical Michael Jackson) the likeness makes us feel uncomfortable.
The concept of uncanny valley relates not only to physical likeness of humans, but to activities that are typically human. When I “converse” with Cleverbot, I sometimes get that uncanny feeling that I am getting uncomfortably close to speaking with a mock-up of a real person. (Come to think of it, I also get that with some supposedly real people, but let’s just leave it at that.) Fortunately, Cleverbot mostly still provides responses that are pretty much to the left on the human-likeness axis, (i.e. pretty stupid / funny), and stay well-away from the uncanny valley. (Although this converation I had with Cleverbot was interesting.)
Protein Function Annotation and Evidence
One thing at which software seems to be really getting better, is classifying stuff. Just look at your email spam filter. My Gmail filter is pretty good in sorting the wheat from the Canadian Viagra. Spam filtering is a two-way classification problem: the software has to “decide” whether any email needs to go to the Inbox, or to Spam. Other problems are multi-way classification problems, for example, that of protein function annotation. What is the function of a given protein? There are millions of different things proteins do in life. Also, there are millions of protein sequences in databases, and most of them are unannotated: we have no idea what they do. The overwhelming majority (98%) are annotated by computational methods, with no human oversight. Since genomes starting coming out in droves, a new class of biologists — biocurators — are working to properly assign functions to sequences, mostly protein sequences. Biocurators look at sequences, and assign function using whatever evidence they can find. The best evidence would be if a protein was subject to an experiment that has been published. The curator reads the article, and assigns a function or functions to the protein (annotates the protein). The commonly accepted vocabulary for protein function annotation is the Gene Ontology. The Gene Ontology, or GO, is used to describe what we know about protein function in a standard fashion. Proteins are assigned standard terms such as “protein tyrosine kinase activity“, or “hydrogen:potassium-exchanging ATPase complex“. GO not only lets us record function in a universally accepted standard, it provides a mechanism for us to record how we know what we know through the use of evidence codes. Evidence codes are used by curators to record how they inferred the gene function. The first class of evidence codes describes different types of experimental evidence: “inferred by protein interaction” or “inferred by genetic assay”. A second class of evidence codes is comprised of GO terms provided by curators but where no experimental evidence exists for the protein’s function. From the GO site: “Use of the computational analysis evidence codes indicates that the annotation is based on an in silico analysis of the gene sequence and/or other data as described in the cited reference. The evidence codes in this category also indicate a varying degree of curatorial input.” The computational analysis evidence codes include inferred from key residues (IKR) or inferred from sequence or structure similarity (ISS). It’s important to remember here that function assignment is not done by producing experimental evidence, but by bioinformatic means, supervised by the human curator.
A third class of evidence codes is given when the GO term was not assigned by a human curator, but by electronic means only. Those are the automatically assigned evidence codes. This is “IEA” or Inferred by Electronic Annotation. 98% of the annotations out there are, in fact, IEAs, and were not viewed by a human.
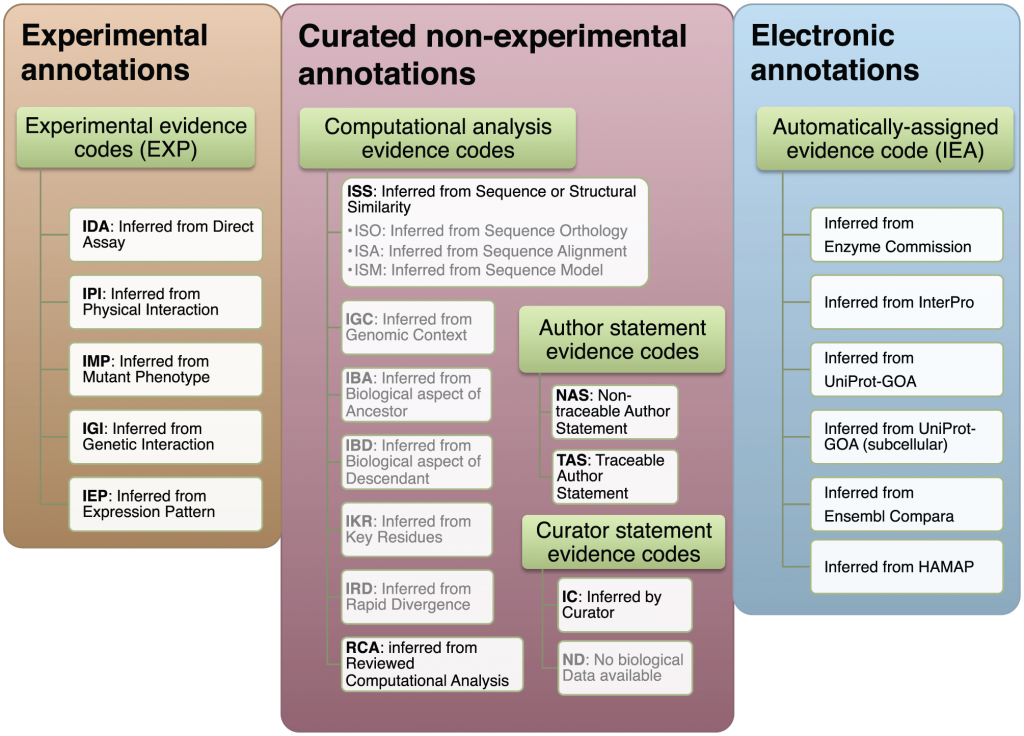
“We group the GO evidence codes in three groups: experimental, non-experimental curated, and electronic. Gray text denotes the evidence codes that were not included in the analysis: they are either used to indicate curation status/progress (ND), are obsolete (NR), or there is not enough data to make a reliable estimate of their quality (ISO, ISA, ISM, IGC, IBA, IBD, IKR, IRD). The subdivision of the evidence codes (green rectangles) reflects the subdivision available in the GO documentation: http://www.geneontology.org/GO.evidence.shtml. doi:10.1371/journal.pcbi.1002533.g001”
Among these three classes of evidence, the ranking for quality seems intuitively obvious. At the top, there is the experimental evidence. Then, the curated but non-experimental evidence: non-experimental, yet viewed by a curator. This evidence includes the computational analysis evidence, as well as statements by the authors from which the curator inferred the function. Finally, the automatically assigned evidence codes, the IEA, would be the lowest. I mean, would you really trust Cleverbot to annotate your protein as well as a seasoned curator?
Actually, you might trust Cleverbot…
Nives Škunca and her colleagues at ETH Zurich have decided to see how well do the curated, non-experimental annotations compare with the non-curated ones. Surprise: the non-curated annotations are of a comparable or better quality. Uncanny.
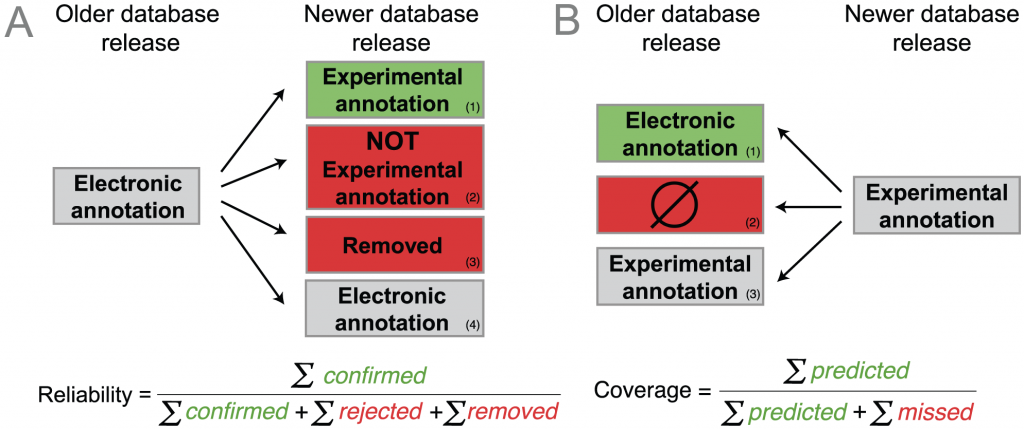
How did they determine that? Figure 2 in the paper illustrates their method (see below). They looked at old and new releases of a GO-annotated database, Uniprot-GOA. The idea is that some proteins that were annotated electronically in the old version will have experimental annotations in the new version that confirms the electronic annotation. (A1, below). On the other hand, the annotation may be wrong, cases A2 and A3. A3 is an implicit rejection: the annotation was removed in a later version. Finally, the electronic annotation may just remain the same (case A4). The reliability of the electronic annotation is the fraction of the electronic annotations that were confirmed out of all confirmed and rejected annotations. So reliability “measures the proportion of electronic annotations confirmed by future experimental annotations”. (From the paper.)
But having different database versions means we can also look backwards in time, as in B. This is the coverage which “measures the extent to which electronic annotations can predict future experimental annotations: an experimental annotation in the newer release is either B1) correctly predicted by an electronic annotation in the older release, or B2) not correctly predicted.” (Quote from the article.)
Having two quality measures for every annotation, they can now be plotted in two dimensions. Intuitively, we would consider a better performance as that in which both reliability and coverage are high. So on a standard x-y plot, the closer the score is to the upper-right corner, the better the quality of the annotation. The next figure shows the qualities of the 1/2008 Uniprot-GOA release as measured through the lens of the 1/2011 release, three years later. The circle size corresponds to the frequency of the GO term in Uniprot-GOA, the center of the circle being the frequency of the GO term. The different aspects of function are shown in the three panels: molecular function, biological process and cellular component are shown. If you would like to see what each circle is, and view results in other time-frames, the authors have prepared a really cool interactive version of this plot.
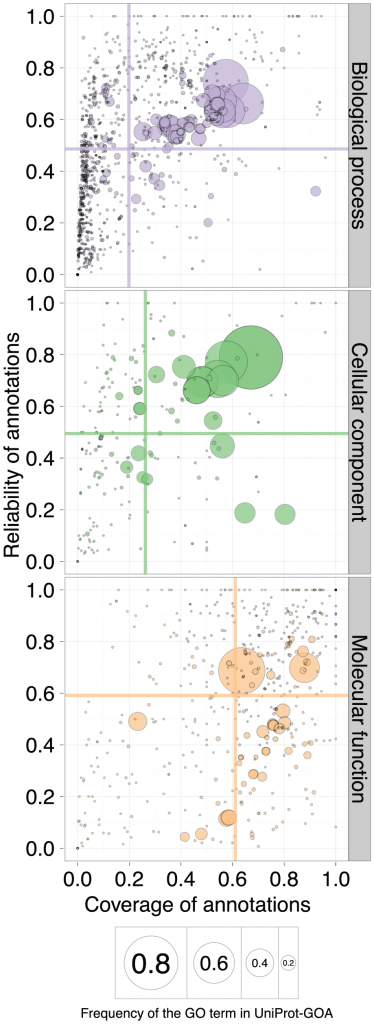
“A scatterplot of coverage compared to the reliability for the GO terms of the three ontologies: Biological Process, Cellular Component, and Molecular Function. The area of the disc reflects the frequency of the GO term in the 16-01-2008 UniProt-GOA release. The colored lines correspond to the mean values for the respective axes. To be visualized in this plot, a GO term needs to have assigned at least 10 electronic annotations in the 16-01-2008 UniProt-GOA release and at least 10 experimental annotations in the 11-01-2011 UniProt-GOA release. An interactive plot is available at http://people.inf.ethz.ch/skuncan/SupplementaryVisualization1.html.” doi:10.1371/journal.pcbi.1002533.g005
Unsurprisingly, the large circles correspond to GO terms that are general, like “Protein Binding” (for the molecular function ontology) , “Cytoplasm” (cellular location) or “Metabolic Process” (in the biological process ontology). The colored lines are drawn along the mean values of the axes.
Humans or machines?
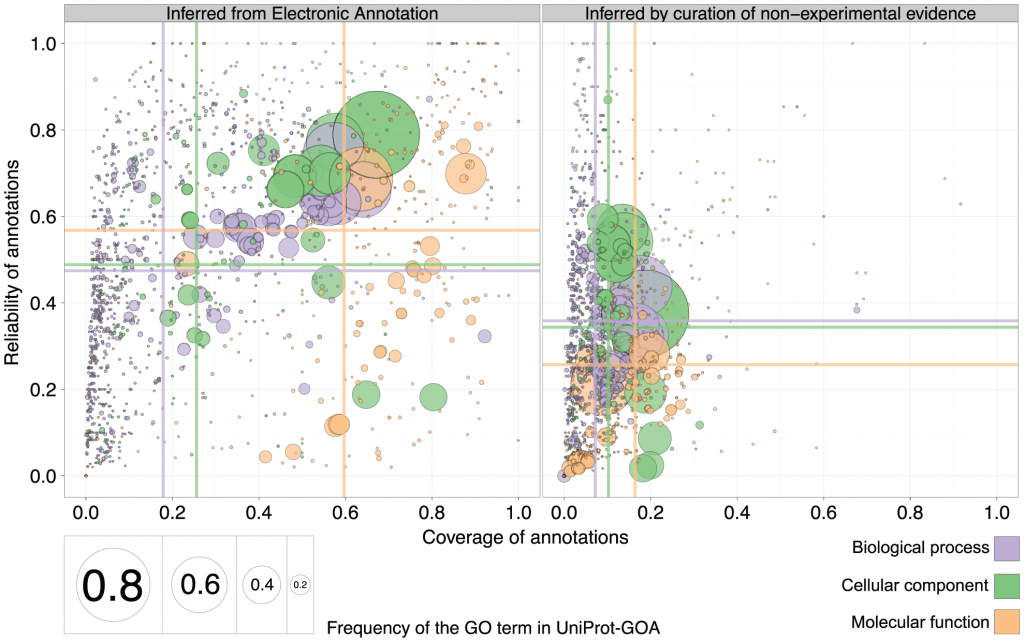
The authors then went on to compare the reliability and coverage of annotations curated using non-experimental evidence to those of annotations curated electronically (IEA). The predictive power of purely automated methods (IEA) is shown on the left, and results from inference by curation of non-experimental evidence is on the right. Surprise: the mean reliability and coverage are actually higher for IEA annotations than for curated annotations. Especially coverage, and especially in the Cellular Component ontology.
So what is going on here? Are algorithms really better at annotating function that humans? After all, seems like they are beating humans hands-down, both in reliability and in coverage. To follow, are a few critical thoughts. I have no idea if what i am saying below is true or not. These are thoughts based on reading this paper. Perhaps these questions can be answered with some more research.
1. Why is the reliability (or specificity) for electronic annotations higher? The authors compared electronic annotations with no human supervision to (mostly) electronic annotations supervised by humans (ISS: inferred by sequence or structure similarity). The other type of human-supervised annotations were of author statements found in the papers (TAS and NAS evidence codes), and the “inferred by curator” (IC) evidence code. I could not find how many were annotated with TAS+NAS+IC evidence codes and how many by the ISS and RCA (which are the human-curated electronic ones). Therefore, part of the reason humans are not performing better than electronic, is that it is basically humans that are doing electronic annotations, as opposed to machines that are doing electronic annotations. The former may have better judgement, but the latter are covering a much larger volume of proteins to annotate. As a result, the specificity (“reliability”) of non-human annotations is slightly higher, if many of the experimental GO terms that are being compared to are general enough. The coverage (sensitivity) is higher (see below), but as a result of higher coverage in large numbers on low-information GO terms, the reliability (specificity) is higher.
(Also, the RCA-based annotations turned out not to be that reliable, and the authors dropped them in an alternate figure in the supplement. This actually made human and electronic reliability closer, but non-human still beats human).
2. Why is the coverage for electronic annotations higher? Perhaps because humans tend to be more specific and function prediction methods may produce more general GO terms? If you are saying that a protein has a “binding” function, you are saying very little, but you increase your chances on being right covering all different types of binding. If you are saying that a protein is “transcription factor binding”, you are being much more specific, but you have a better chance of being wrong. I did not see a comparison of specificity of GO terms with non-IEA evidence codes to the IEA evidence codes. But if IEA based evidence codes are attached to more general GO terms, this would explain, to some extent, why electronic annotations have a better coverage. Another explanation, of course, is the sheer mass of proteins that are annotated electronically-only. This would give non-human electronic annotations better coverage than humans by sheer numbers only.
In any case, this is quite uncanny, and very important. Seems like “da machines” are better at the game of annotation than us. Or too close for comfort. This tells us that we are either relying too much on fully electronic annotations, or not enough. Not sure which is right, and what we should be doing about it now.
![]()
Škunca, N., Altenhoff, A., & Dessimoz, C. (2012). Quality of Computationally Inferred Gene Ontology Annotations PLoS Computational Biology, 8 (5) DOI: 10.1371/journal.pcbi.1002533






Hi,
Could this be similar to the early relative success of AI in abdominal diagnosis: doing better in a sea of mediocre data than humans looking out for stand-out signals?
Rgds
Damon
Thanks Iddo for your interest in our work!
Regarding your second question, it’s not all that surprising that the coverage of electronic annotations is higher (your second question), because annotating proteins computationally is faster/cheaper and scales better than doing it through curators. If anything, the difference is actually stronger than our plots suggest, because to make things comparable, our plots are restricted to terms common to both electronic and curated terms. If we consider all terms, the coverage of electronic annotations is comparatively even higher because many terms are only annotated electronically.
As for your first question (“why is the reliability of electronic annotations higher?”), it’s much more difficult to answer. As you correctly point out, the difference between electronic and curated annotations varies considerably depending on the subcategories considered, so we had to be conservative in drawing conclusions. Our supplementary figures S10 in particular shows the large variation among different subcategories of curated annotations (http://www.ploscompbiol.org/article/fetchSingleRepresentation.action?uri=info:doi/10.1371/journal.pcbi.1002533.s001)
Finally, you might be interested to know that I have just written a post on the “story behind the paper”: http://christophe.dessimoz.org/orf/2012/06/story-behind-our-paper-on-the.html
Thanks again for the nice article and pertinent thoughts!
Christophe
[…] Here is Iddo Freidberg’s analysis http://bytesizebio.net/index.php/2012/06/14/annotating-proteins-in-the-uncanny-valley/ […]