Skin Flick 2: Statistic Boogaloo
Reports on the first metagenomic survey of skin bacteria (see my previous post) did not go unnoticed by the popular media. Reports appear in US News & world Report, LA Times, Times of India, National Geographic, and Scientific American. All these articles have one thing in common: they are wrong. Yes, even Scientific American.
All those articles reported, among other things, on the most diverse and least diverse bacterial skin populations using samples taken from different sites on the skin. All of them, to a tee, reported that the forearm has the highest species diversity, and the least diversity is behind the ears.
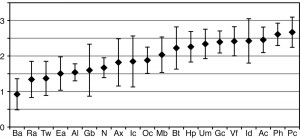
Let us look at the figure from the article (Figure 2, Grice EA et al. Science 29 May 2009:
Vol. 324. no. 5931, pp. 1190 – 1192):
The different sites are spread along the X axis. The diversity using the Shannon-Wiener diversity index is shown along the Y axis. A higher number means a higher diversity. The data points represent the median diversity from the ten people surveyed. Grice and her colleagues also included error bars in this figure, showing the absolute deviation from the median.
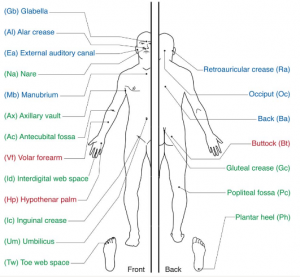
There is a two-way tie-in for the highest diversity between the Pc (behind the knee) and Ph (planar heel) points. Then come the Ac (elbow pit) and the Id (finger webbing) with Vf (forearm) coming only fifth. Also, if you consider the error bars, it is highly likely the differences between those medians are not statistically significant. Also, the site with least diversity is the back (Ba), while the retroaural crease (Ra, behind the ears) is second to last in diversity. Also, the error bars may make this a tie too.
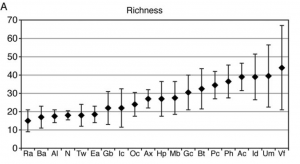
So what is going on here? Why does everyone claim that the forearms harbor the highest bacterial diversity, when the Science article reports they are only fifth or part of a large tie-in? The sort-of answer seems to lie in the supplemental material, Figure S3. In absolute species numbers, it does seem like the forearms have the most species, with a median of 44; although again, error bars are pretty extensive.
Why is the Shannon-Wiener diversity showcased in the front of the article, and the number of species (richness) relegated to the back, while all the channels report on the median richness and calling it diversity? Well, you can hardly blame them when Science itself reports, in its front window, the same thing. Well why is that?
My explanation is that it is easier to understand species richness (the actual number of species) than species diversity. The Shannon-Wiener diversity (SWD) provides a sum of the relative abundance of each species: that is, the contrast between the number of species we find and the number of species we expect given the number of individual animals (or clones, in this case) sampled. Diversity is more descriptive and informative than richness, since it provides us with a measure of how many species there are relative to what we expect, not just an abslolute number. However, this concept is not easy to communicate. So someone in the Science press office decided to write a press-release with richness numbers, but omitted the distributions, and conflated richness and diversity.
This example highlights a larger subject: how to communicate science effectively, but without errors resulting from over-simplification? Where does the border lie between simplifying, dumbing down, and being simply wrong? In this example, the error is relatively minor: terms have been switched, but it is clear that the true values have been given. Highlighting a metric people can understand to communicate your work, even if it is not the best one, is better than using another, more informative one but which will simply obfuscate the entire work. Science communication should be kept simple and that usually means that some details get lost along the way. We just need to make sure that the core ideas are there, and that loss of details does not mean loss of reporting accuracy.
I would like to thank Elizabeth Grice for answering my questions so quickly and fully. If you are interested in some more skin microbiome details, here she is giving a talk at the Metagenomics 2008 meeting, held last November at UC San Diego:
Elizabeth Grice, Talk CALIT2 November 2008
Stephanie Pappas (2009). Your Body Is a Wonderland … of Bacteria ScienceNOW DOI: http://sciencenow.sciencemag.org/cgi/content/full/sciencenow;2009/528/1
Katherine Harmon (2009). Genetic survey finds healthy human skin is crawling with bacteria Scientific American DOI: http://www.scientificamerican.com/blog/60-second-science/post.cfm?id=genetic-survey-finds-healthy-human-2009-05-28
Elizabeth A. Grice, Heidi H. Kong, Sean Conlan, Clayton B. Deming, Joie Davis, Alice C. Young, NISC Comparative Sequencing Program, Gerard G. Bouffard, Robert W. Blakesley, Patrick R. Murray, Eric D. Green, Maria L. Turner, & Julia A. Segre (2009). Topographical and Temporal Diversity of the Human Skin Microbiome Science, 324 (5931), 1190-1192 DOI: http://www.sciencemag.org/cgi/content/full/324/5931/1190
Comments are closed.


