When Your Local Sewage Dashboard Glows: A 2026 Reader’s Guide to UK Wastewater Surveillance
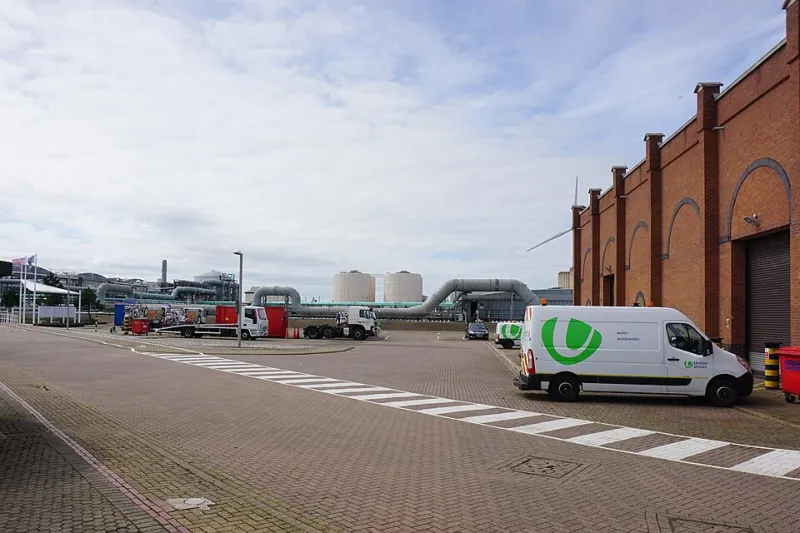
Photo: Bill Boaden , CC BY-SA 2.0, via Wikimedia Commons
You open your council’s public-health page and see it: a little orange dot next to norovirus, or an upward arrow beside an antimicrobial resistance gene. Maybe the accompanying note says ‘increasing signal detected in wastewater’. It sounds dramatic. It is also, in 2026, fairly ordinary. Wastewater surveillance has shifted from a pandemic stopgap to a routine UK monitoring tool, with water companies, universities, local councils and public-health teams sampling sewage for viruses, AMR markers and other biomarkers.
That does not mean the dashboard is a crystal ball. Think of it more like a smoke alarm in a large building: useful, sensitive, and occasionally set off by burnt toast. The skill is knowing what the alarm is connected to.
From Flush to Filter: The Sampling Chain
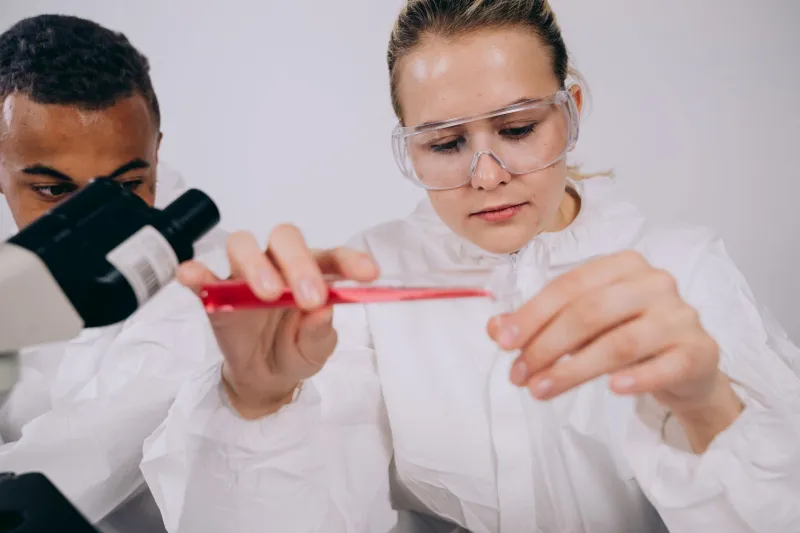
Most UK wastewater surveillance starts at treatment works, where composite samplers collect flow-weighted samples over hours or days. Some programmes use grab samples; others, especially in research settings, sample smaller sewersheds such as a campus or hospital site. The sample is concentrated — ultrafiltration and precipitation are common — then nucleic acids are extracted and tested by quantitative PCR, digital PCR or sequencing.
The result is usually reported as gene copies per millilitre, often normalised to flow or to a faecal indicator marker so that a rainy week or a population spike does not look like an outbreak. Labs may compare the current week against a rolling baseline rather than a fixed threshold. That is why ‘signal detected’ can mean very different things in different places.
What a Positive Result Actually Counts
A positive wastewater result tells you that genetic material from the target was present in the sample. It does not tell you that the virus was infectious, that it came from a human, or that your neighbour has it. Shedding rates vary between people and across infection stages. Dilution, sewer travel time, industrial discharge and combined sewer overflows after heavy rain can all muddy the picture.
AMR genes deserve their own caution. Detecting a resistance gene in sewage is not the same as finding a resistant infection in a patient. Sewage carries resistance genes from environmental bacteria, animal sources and human gut flora. The public-health question is usually about trends and relative abundance, not a single positive result.
The Dashboard Is a Prompt, Not a Diagnosis
For public-health teams, a rising wastewater signal can prompt further sampling, targeted clinical surveillance or clearer local communication. It can support variant tracking or show that a seasonal virus is circulating earlier than expected. It should not, on its own, be used to declare an outbreak or to tell individuals to change their daily behaviour.
If your local dashboard lights up, ask what is being measured, over what period, and against what baseline. Is the signal a single detection or a sustained trend? Has it been confirmed by clinical data? Is the lab reporting a quantified concentration or just presence/absence? Those questions turn a scary colour into a useful data point.
Privacy Questions for a Small Sewershed
Sewage is pooled, which is good for privacy in a city-sized catchment. It is less reassuring when sampling happens at a building or campus level. Small sewersheds can, in theory, narrow a signal to a relatively small group of people. That is why governance matters as much as lab technique.
Ask who can see the raw data, how small the reporting area is allowed to get, and whether results are aggregated before publication. UK GDPR does not automatically make sewage data ‘personal data’, but small-area sampling can raise ethical and employment concerns. A dashboard that helps a council plan services is different from a dashboard that lets a manager infer something about a staff building.
Lab Quality: The Boring Bits That Decide
Wastewater methods are not plug-and-play. Good labs run positive and negative controls, check for PCR inhibition, measure recovery through the concentration step and report their limit of detection. They may use replicate samples and interlaboratory comparisons. Accreditation to a recognised standard helps, but it is not a magic wand; the method sheet and uncertainty still matter.
The wording on the dashboard matters too. ‘Detected’ is not ‘quantified’. ‘Increasing’ is not ‘high’. A result reported to three decimal places can look precise while carrying wide uncertainty. For professionals, the useful question is not just ‘what did you find?’ but ‘how would you know if you were wrong?’
What to Do When the Signal Rises
For most readers, the practical advice is reassuringly dull. Watch the trend rather than one dot. Check whether clinical cases are also rising. Keep up ordinary hygiene, especially around food and vulnerable people. If you are unwell, follow NHS guidance rather than trying to reverse-engineer the sewer map.
Wastewater surveillance is one lens on population health, not a personal test result. In 2026, it is a genuinely useful part of the UK’s diagnostic toolkit — but only when we read it with the same care we would apply to any other lab result.