
A Belated Valentine’s Day Post
This is romantic! So listen up!
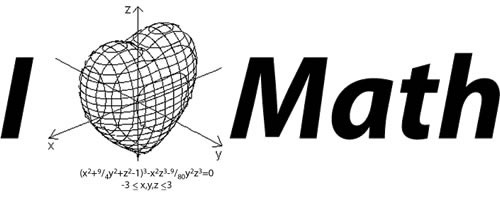
A 3D heart shape may be drawn using the following implicit function:
Or, in Python:
def  heart_3d(x,y,z):
    return (x**2+(9/4)*y**2+z**2-1)**3-x**2*z**3-(9/80)*y**2*z**3
Trouble is, there is no direct way of graphing implicit functions in Python. But anything can be found on Stack Overflow.
Putting it all together:
#!/usr/bin/env python
from mpl_toolkits.mplot3d import Axes3D
from matplotlib import cm
from matplotlib.ticker import LinearLocator, FormatStrFormatter
import matplotlib.pyplot as plt
import numpy as np
def heart_3d(x,y,z):
   return (x**2+(9/4)*y**2+z**2-1)**3-x**2*z**3-(9/80)*y**2*z**3

def plot_implicit(fn, bbox=(-1.5,1.5)):
    ''' create a plot of an implicit function
    fn  ...implicit function (plot where fn==0)
    bbox ..the x,y,and z limits of plotted interval'''
    xmin, xmax, ymin, ymax, zmin, zmax = bbox*3
    fig = plt.figure()
    ax = fig.add_subplot(111, projection='3d')
    A = np.linspace(xmin, xmax, 100) # resolution of the contour
    B = np.linspace(xmin, xmax, 40) # number of slices
    A1,A2 = np.meshgrid(A,A) # grid on which the contour is plotted

    for z in B: # plot contours in the XY plane
        X,Y = A1,A2
        Z = fn(X,Y,z)
        cset = ax.contour(X, Y, Z+z, [z], zdir='z',colors=('r',))
        # [z] defines the only level to plot for this contour for this value of z

    for y in B: # plot contours in the XZ plane
        X,Z = A1,A2
        Y = fn(X,y,Z)
        cset = ax.contour(X, Y+y, Z, [y], zdir='y',colors=('red',))

    for x in B: # plot contours in the YZ plane
        Y,Z = A1,A2
        X = fn(x,Y,Z)
        cset = ax.contour(X+x, Y, Z, [x], zdir='x',colors=('red',))

    # must set plot limits because the contour will likely extend
    # way beyond the displayed level.  Otherwise matplotlib extends the plot limits
    # to encompass all values in the contour.
    ax.set_zlim3d(zmin,zmax)
    ax.set_xlim3d(xmin,xmax)
    ax.set_ylim3d(ymin,ymax)

    plt.show()

if __name__ == '__main__':
    plot_implicit(heart_3d)
Show this to your date on the next Valentine’s Day, because it is too late for this one. Trust me, results are guranteed. Not sure what kind of results though.


What about this?
Copy-paste this in Google:
5 + (sqrt(1-x^2(y-abs(x))^2))cos(30((1-x^2-(y-abs(x))^2))), x is from -1 to 1, y is from -1 to 1.5, z is from 1 to 6
Wicked! Thanks, Julien.